
Hierarchy Map
Hierarchy Map provides a management consumable format to visualize data.
This document explains everything you need to know to create hierarchy maps. If you want to just review a particular topic, select the link below to skip to that section:
- Creating a Hierarchy Map
- How to configure the Hierarchy Map
- Saving and Loading Hierarchy Map Settings
- Realtime Rendered Hierarchy Map
- Applying Realtime indicators
Hierarchy Maps provide a management consumable format to visualize data. Typical Hierarchy Maps are Org Charts, Capability Maps, Service Maps etc.
Designer provides a flexible way to create Hierarchy Maps visualizations on any table. This feature processes the underlying data in the following way:
- Shows parent/child relationships (hierarchical data) as nested containers by hiding the connections visually.
- Includes elements connected via downstream m2m relationships (CI relationships) within the container by hiding the connections visually.
- Shows elements connected via upstream m2m relationships (CI relationships) by keeping the connections visually.
- Keeps flexibility to change shape styling and positioning.
- Supports any other feature e.g. Realtime Indicators.
Creating a Hierarchy Map
To create a hierarchy map:
- Select the INSERT ribbon.
- Select ‘Hierarchy Map’.
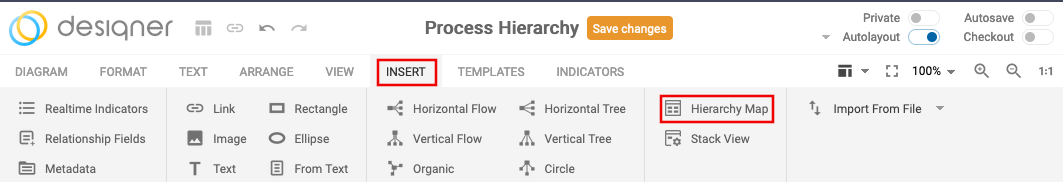
The Hierarchy Map Settings menu appears.

How to configure a Hierarchy Map
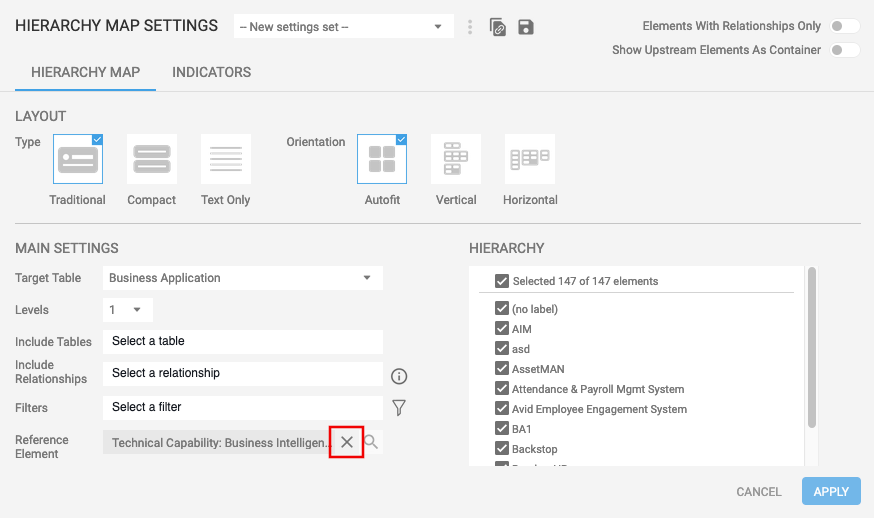
Here is an overview of the Hierarchy Map Settings:
Basic navigation
There are two main tabs in the Hierarchy Map Settings menu.
Hierarchy Map tab: Default view; here you define a hierarchy map.

Indicators tab: Select this tab to add indicators to your diagram. For a more detailed explanation of this feature, review Applying realtime indicators.

All settings discuss in this section are located in the Hierarchy Map tab
Layout options
There are two options for adjusting the layout of your diagram:
- Type
- Orientation
Type
There are 3 different types of layouts you can select from:

- Traditional: The traditional hierarchy map type will keep the original styling from the class definition table. In the example below the Business Capabilities are using the UPM·X shapes including icons, label with table name, and the name of the Business Capabilities.
- Compact: The compact hierarchy map type keeps the icon of the shape if available, but removes the table name label. Additionally, it scales down the shape size to 170x46 pixel to provide a more compact view of the hierarchy map.
- Text Only: The text-only hierarchy map type removes any shape icon and table name label. The shape size is scaled down to 160x40.
Leveraging the Text Only Hierarchy MapBe aware, that the Text Only Hierarchy Map consumers will not directly see the type or table name of the shapes. Ideally, only use one type of objects e.g. Business Capabilities to make the diagram consumable.

Orientation
The Orientation is influencing the layout and positioning of the shapes within the containers.

- Autofit: Designer will try to make the full diagram fit by orienting all containers and shapes into a single page.
- Vertical: The Vertical orientation will ensure, that the containers are oriented from top to bottom. Change the number of columns to influence the amount of shapes per line.
- Horizontal: The Horizontal orientation will ensure, that the containers are oriented from left to right. Change the number of columns to influence the amount of shapes per line.
Main settings

Target Table: Select the ‘Target Table’ which indicates the starting point and basis of the hierarchy map. E.g. if you want to create a map where applications are grouped by capability, select Business Capabilities here. The capabilities will be shown hierarchically. If a hierarchy (parent/child relationships) does not exists, elements will be shown as single containers including related items within the container.
Levels – Select the number of levels the capability map should include. Maximum 10 levels are supported.
NOTEBased on the level depth and number of relationships the creation of the Hierarchy Map can take up to multiple minutes. Use the ‘Include Tables’ and ‘Include Relationships’ options to minimize the query time.
Include Tables – The ‘Include Table’ option provides the ability to exclude all other tables except the selected ones. E.g. selecting Business Applications will show them as part of the selected Target Table (see point C). All other tables except Business Applications will be ignored.
Showing only a single object typeSelecting the same table for both Target Table and Include Table will provide you a hierarchy map excluding all other object types. E.g. selecting Business Capabilities for Target and Include Table will show a Business Capability Map without any other tables.
Include Relationships – The ‘Include Relationships’ option provides the ability to exclude all other suggested relationship types except the selected ones.
In the example above, Business Capabilities connected to Business Applications and/or Strategies only connected via the suggested relationships ‘impacts::impacted by’ and ‘Provided by::Provides’ will be shown—all other relationship types will be ignored.
Use this option to filter the view for specific suggested relationship types.
Leave this option empty to include all relationship types.
Combine this option with the ‘Target Tables’ option to further restrict the query to selected target tables.
Filters – Any global and personal filters defined can be selected here to restrict the content of the hierarchy map. Click the filter icon to configure the filter.
Please note, that the filter criteria will check the hierarchy structure from top to bottom. If a filter criteria does not match e.g. on level 2, the full branch including all childs will be excluded
Reference Element: This lets you select a specific table and element to generate a hierarchy map.
Delete Reference Element: You can easily delete any Reference Element included in the main settings by selecting the X icon to its right.
Hierarchy section
Here you can select all or particular elements to create a hierarchy map. This section has the following layout
- Selected section — This area shows the selected and total number of elements. Once the target table is selected you can see the data available.

- Elements section — Select the parent and child elements to be included and unselect those to be excluded.

Additional settings
Elements with Relationships Only – Toggle this button on to remove any Target Table elements, which do not have m2m relationships to any other elements.
Turn off this option to show elements, too which does not have any upstream or downstream related items.

Show Upstream Elements As Container – Toggle this button on to visualize connected upstream elements as containers.

Turn off this option to show upstream elements based on the Class Definition shape styling and its relationship.

Upstream Elements as ContainerUsing this option can multiply number of containers if the upstream element is connected to multiple Target Table elements.
Saving and Loading Hierarchy Map Settings
Hierarchy Map settings can be saved for quick reuse including realtime indicator settings. Additionally, the hierarchy settings can be used as part of the presentation mode to render the hierarchy map live every time you visualize it in the presentation mode without saving the diagram.

Saved setting dropdown menu: This menu shows the available saved hierarchy map settings. Click to load the settings.

Additional Options: Once settings are saved and selected, additional options to rename and delete are available.

Save: After the layout and main settings of the hierarchy are set, the save button is enabled. Click the save button and enter a name for the settings. The settings name will be shown under point M.
Realtime Rendered Hierarchy Maps

Share: Once settings are saved (see point P) you can copy a special link for the presentation mode, which renders a diagram with the settings in real-time including the realtime indicator settings. This way you can ensure, that the hierarchy map is always 100% updated and in alignment with your live data in the presentation mode.
Updating Hierarchy MapsOnly Realtime Rendered Hierarchy Maps are completely rebuilding the full hierarchy map in the presentation mode.
Hierarchy Maps created and saved as a diagram will not update automatically. Only realtime indicators are updating automatically.
Applying Realtime Indicators
The Hierarchy Map Settings allows you to quickly apply Realtime Indicators while defining the Hierarchy Map. These settings can be saved for quick reuse e.g. for Realtime Rendered Hierarchy Maps.
By default the Hierarchy Map Settings menu opens with Hierarchy Map tab active. To add realtime indicators to your diagram:
- Select the Indicators tab.

The Indicators tab appears.

The Indicators tab has the following features:

Select table — Select the table to apply a realtime indicator to. All tables with defined realtime indicators will show up here.

Select field: Select the field. All fields available as part of the defined realtime indicators table will show up here.

Select view: Select the Indicator View. In total there are 7 different views available, where the colors and amount is driven by the Realtime Indicator definitions.
For a more detailed account of views and other realtime indicators, check Using Realtime Indicators

Position: Select where the realtime indicator should be shown on the shape. You can position indicators inside and outside of the shape (except Background T1 & Border T2 Realtime Indicators).

Adjust position: Change the positioning of the indicator from left to right, or top to bottom, or vice versa based on the selected position (see U).

Add Indicator: Select this button to add the configured indicator.

Applied Indicators: You can see the applied realtime indicators in this area. Click the X icon to remove an indicator.
Updated 12 months ago